
Table of Contents
The "cup and handle" is a bullish chart pattern that is favored among traders for its ability to predict an upward continuation of an asset’s price.
Here’s a breakdown of how to recognize and interpret this pattern:
Structure
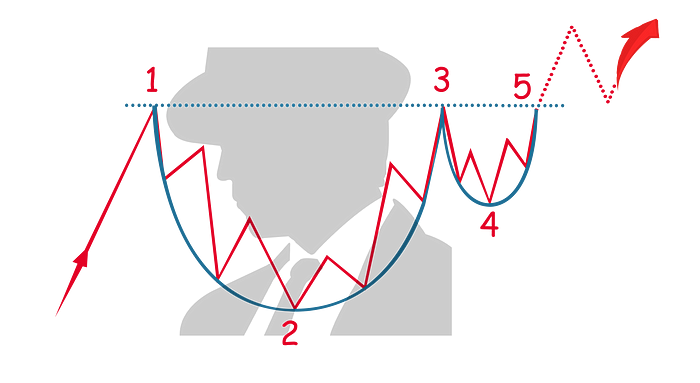
The cup and handle pattern consists of two main parts:
- The Cup: This forms after a price advance and resembles a rounded bowl or a "U" shape. It represents a period where the price consolidates or moves sideways after an initial uptrend, followed by a slight downward drift, and then a rise back up to the original start point of the decline. The cup ideally should have a smooth, rounded bottom and not be too deep compared to the trend that preceded it. The duration of the cup can range from several weeks to many months and is often a sign of a consolidation phase where the market is reassessing its position before continuing the prior trend.
- The Handle: After the formation of the cup, the price forms a small downward drift, creating a "handle." This part of the pattern is typically shorter and shallower than the cup. It should not drop into the lower half of the cup and is usually seen as a final consolidation before a breakout. The handle often takes the form of a descending triangle or a tight price channel.
Significance
This pattern is significant because it represents a bullish continuation, suggesting that after a period of consolidation, the prevailing uptrend is likely to resume. The handle portion allows for the accumulation of the asset while shaking out weak holders before the upward movement continues.
Trading Considerations
- Entry Point: Traders often look for entry points once the price breaks above the handle’s resistance, as this breakout can confirm that the uptrend is likely to continue.
- Volume: Volume should diminish during the formation of the handle and increase significantly during the breakout, supporting the price increase.
- Target Price: The target price after a breakout can be estimated by measuring the depth of the cup and projecting that distance upward from the point of breakout.
- Risk Management: It's important to consider a stop-loss order below the handle to protect against the possibility that the expected breakout fails.
The cup and handle pattern is popular due to its relatively straightforward identification and the clear trading signals it provides. However, like all trading strategies, it's most effective when combined with other technical analysis tools to confirm trends and potential buy signals.


