
Table of Contents
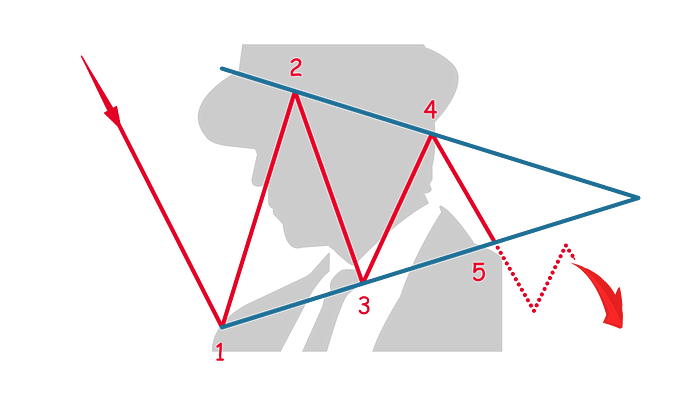
A bearish symmetrical triangle is a chart pattern used in technical analysis that suggests a continuation of a prevailing downtrend. It forms when the price of an asset consolidates between converging trendlines of support and resistance, leading to a narrowing price range and reduced volatility.
The pattern is characterized by a series of lower highs and higher lows, indicating that neither buyers nor sellers are able to push the price decisively but with an overall bearish bias given the context of a prior downtrend.
Formation
- Converging Trendlines: The pattern is formed by drawing a descending trendline that connects a series of lower highs and an ascending trendline that connects a series of higher lows. The point where these trendlines converge is known as the apex.
- Consolidation Phase: This phase is marked by a contraction in the price range as the asset makes progressively lower highs and higher lows, leading to increased uncertainty among traders about the future price direction.
Characteristics
- Volume: Volume typically decreases as the symmetrical triangle develops, reflecting the dwindling trading activity during consolidation. A significant increase in volume is expected at the breakout, validating the pattern and indicating a continuation of the downtrend.
- Duration: Symmetrical triangles can take shape over various time frames, from a few weeks to several months. Patterns that take longer to form are generally considered more reliable for predicting future price movements.
Trading Considerations
- Entry Point: Traders often consider entering a short position when the price breaks through the lower trendline (support) on strong volume. This breakout is seen as confirmation that the previous downtrend is likely to resume.
- Stop-Loss: A stop-loss can be placed just above the upper trendline of the triangle or above the most recent swing high within the triangle. This positioning helps protect against the risk of a false breakout or a reversal in price direction.
- Profit Target: The profit target can be determined by measuring the maximum height of the triangle at its start and then subtracting this distance from the breakout point at the lower trendline. This measurement gives an estimate of the potential downward move post-breakout.
Psychological Dynamics
The bearish symmetrical triangle represents a period of indecision where the balance between supply and demand is nearing a tipping point. The formation of lower highs suggests that sellers are increasingly eager to sell at lower prices, indicating growing pessimism. Meanwhile, the higher lows reflect buyers’ attempts to push back, albeit with limited success.
Ultimately, the breakout below the lower trendline signals that the sellers have gained the upper hand, overcoming buyers and pushing the price downward. This pattern is particularly useful for crypto traders looking to capitalize on continuation patterns in a bear market, providing clear indications for strategic entry and exit points.


