
Table of Contents
A falling wedge is a bullish chart pattern used in technical analysis that often indicates a reversal of a downtrend or a continuation of an uptrend.
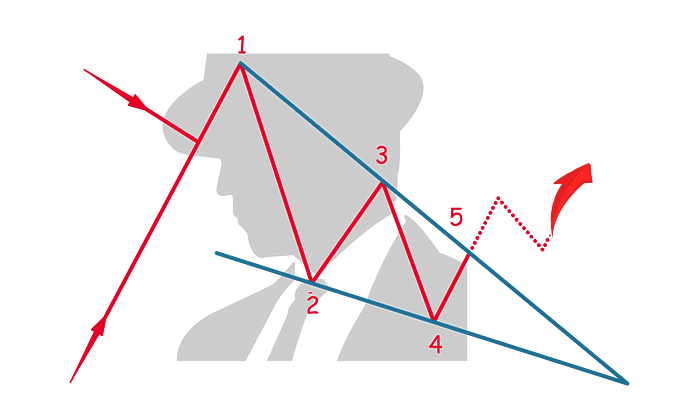
This pattern is characterized by converging trendlines that slope downward, with the upper trendline declining more steeply than the lower trendline.
Here's a detailed overview of the falling wedge pattern:
Formation
- Converging Trendlines: The falling wedge is formed by connecting a series of lower highs and lower lows with two trendlines that converge as they extend. The upper trendline acts as the resistance, and the lower trendline acts as the support.
- Narrowing Price Range: As the pattern develops, the price action contracts and becomes squeezed within the narrowing trendlines, indicating a decrease in downward momentum and a potential bullish reversal.
Characteristics
- Volume: Volume typically decreases as the pattern develops, suggesting a waning of selling pressure. A breakout from the wedge usually occurs on an increase in volume, which helps confirm the bullish reversal or continuation.
- Duration: Falling wedges can take shape over various time frames, from a few weeks to several months. The reliability of the pattern tends to increase with the duration over which it forms.
Trading Considerations
- Entry Point: Traders often consider entering a long position when the price breaks above the upper trendline (resistance). This breakout should be accompanied by an increase in volume as a confirmation of bullish momentum and a likely reversal of the downtrend.
- Stop-Loss: A stop-loss can be strategically placed just below the most recent low within the wedge to protect against the possibility of a false breakout or a resumption of the downtrend.
- Profit Target: The profit target can be estimated by measuring the height at the widest part of the wedge and then projecting this distance upward from the breakout point. This method estimates the potential upward movement post-breakout.
Psychological Dynamics
The falling wedge pattern represents a period where the selling pressure begins to diminish despite the continuation of lower highs and lower lows. The decreasing volume and the contraction of price range suggest that sellers are becoming exhausted and are unable to push the price lower with any significant momentum. When the price breaks through the upper resistance line, it indicates that buyers are regaining control and are prepared to push the price higher, signaling a reversal or continuation of the uptrend.
Understanding the falling wedge pattern helps traders and investors anticipate potential bullish reversals in a downtrend or confirm bullish momentum in an uptrend, allowing for timely and strategic trading decisions in anticipation of price increases.


