
Table of Contents
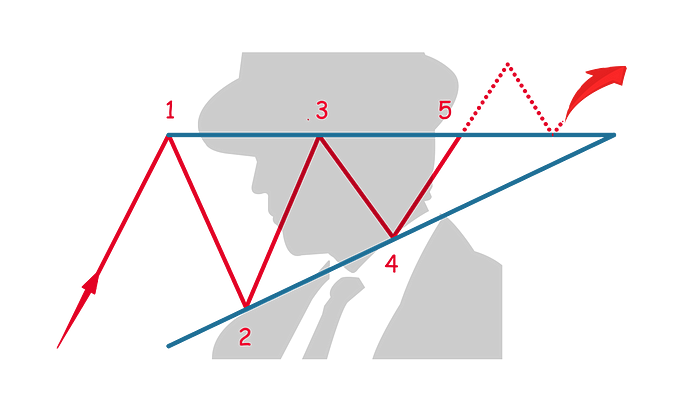
An ascending triangle is a bullish chart pattern used in technical analysis to indicate the potential continuation of an uptrend or a reversal of a downtrend. This pattern is characterized by a flat upper resistance level and a rising lower support line that converges, giving the appearance of a right triangle.
Here’s a detailed breakdown of the ascending triangle pattern:
Formation
- Resistance Level: The top of the triangle is formed by a horizontal resistance line, which is created by connecting at least two similar highs. This line represents a price level that buyers have so far been unable to break.
- Ascending Support Line: The lower line of the triangle is an ascending support line, which is created by connecting higher lows. This line reflects increasing buying pressure as the lows progressively rise.
Characteristics
- Duration: Ascending triangles can develop over any time frame—weeks, months, or even years. The reliability of the pattern tends to increase with longer formation periods.
- Volume: Typically, volume diminishes as the pattern forms, which can indicate a consolidation phase. A breakout through the resistance level should ideally occur on increased volume, providing confirmation of the pattern and a stronger signal for a continuation or reversal.
Trading Considerations
- Entry Point: Traders often consider entering a long position when the price breaks above the resistance level with confirmed volume. This breakout is considered a key signal that buyers have taken control.
- Stop-Loss: A stop-loss can be placed just below the most recent swing low within the triangle or below the ascending support line to protect against a false breakout.
- Profit Target: The target price after a breakout can be estimated by measuring the vertical distance from the highest point of the triangle to the first entry point at the ascending line. This distance is then added to the breakout point to estimate how far the price might ascend.
Psychological Dynamics
The ascending triangle pattern represents a period where demand gradually overcomes supply. The flat resistance level indicates that selling pressure is still present but not increasing, while the ascending lower support line shows that buyers are more aggressive and willing to buy at higher prices. The eventual breakout above the resistance suggests that buyers have consolidated their power and are ready to push prices higher.
Overall, the ascending triangle is a powerful pattern in the trader's toolkit, offering clear indicators for entry and exit strategies, and is generally regarded as a bullish signal in both downtrends and uptrends. Recognizing and correctly interpreting this pattern can help traders capitalize on significant upward moves.


