
Table of Contents
A bearish rectangle is a continuation chart pattern that typically forms during a downtrend in the market. It indicates that the price is likely to continue moving downward once the pattern is completed.
Here's a detailed overview of the bearish rectangle's key features and trading implications:
Formation
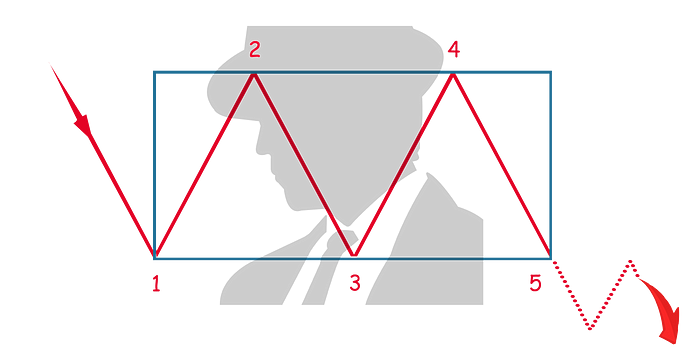
- Consolidation: This pattern occurs when prices move sideways between two parallel horizontal lines after a significant downward trend. The consolidation represents a period of equilibrium where the forces of supply and demand are balanced, with neither buyers nor sellers gaining the upper hand during the pause.
- Support and Resistance Levels: In a bearish rectangle, the upper line of the rectangle acts as resistance, where selling pressure prevents the price from rising further. The lower line serves as support, where buying interest is not strong enough to reverse the downtrend but sufficient to prevent further declines temporarily.
Characteristics
- Duration: The bearish rectangle can last from a few weeks to several months, depending on the chart's time frame.
- Volume: Volume tends to decrease as the pattern forms, which indicates a reduction in trading activity during the consolidation. A breakout often occurs with a noticeable increase in volume, providing confirmation of the continuation of the prior downtrend.
Trading Considerations
- Entry Point: Traders typically consider entering a sell position when the price breaks below the support level of the rectangle. This breakout is viewed as confirmation that the downtrend is set to continue.
- Stop-Loss: A stop-loss can be placed just above the support level that has turned into resistance after the price breaks down.
- Profit Target: The potential decline in price post-breakout can be estimated by measuring the height of the rectangle and projecting that distance downward from the breakout point.
Psychological Dynamics
The bearish rectangle represents a period where the bears are consolidating their gains and the bulls are attempting to regain control but fail to push the price higher. The eventual breakdown below the support level signals that sellers have overwhelmed buyers, leading to a continuation of the downward trend.
Recognizing a bearish rectangle can help you strategically position yourself to capitalize on the continuation of an existing downtrend, effectively managing your trades with a clear understanding of where to set entry points, stop losses, and profit targets.


