
Table of Contents
A triple bottom is a bullish chart pattern used in technical analysis to signal a potential reversal from a downtrend to an uptrend. This pattern is characterized by the price testing a support level three times without breaking it, and subsequently reversing to move higher. The formation is similar to the double bottom, but with an additional test of the support level, indicating even stronger potential for a reversal.
Here’s an in-depth look at the triple bottom pattern:
Formation
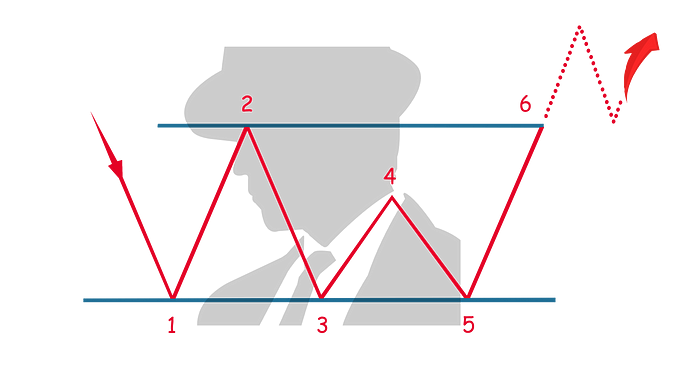
- Three Troughs: The pattern consists of three separate and distinct troughs, each approximately at the same level, indicating strong support where the price fails to break lower. These troughs are separated by two minor peaks.
- Resistance Level (Neckline): The peaks between the troughs create a resistance level, also known as the neckline. The pattern is considered confirmed when the price breaks above this neckline following the third trough.
Characteristics
- Volume: Volume analysis can enhance the reliability of the pattern. Typically, volume might decrease through each successive trough as selling pressure wanes. A breakout above the neckline should occur on higher volume, which signals strong buying pressure and confirms the bullish reversal.
- Time Frame: The triple bottom can develop over various time frames, but patterns observed on longer-term charts generally provide more reliable signals.
Trading Considerations
- Entry Point: Traders might consider entering a long position when the price breaks above the neckline with significant volume. This breakout is the confirmation of the pattern and suggests a strong shift from a bearish to bullish market sentiment.
- Stop-Loss: To manage risk, a stop-loss can be placed just below the lowest point of the third trough or the neckline, to protect against the possibility of the pattern failing and the downtrend resuming.
- Profit Target: The profit target for a triple bottom can be estimated by measuring the vertical distance from the support level to the neckline and then projecting this distance upward from the point of the neckline breakout.
Psychological Dynamics
The triple bottom pattern reflects a turning point in market sentiment. Each time the support level is tested and held, it reaffirms the strength of the support, suggesting that selling pressure is exhausting. The final breakout above the neckline indicates that buyers have regained control and are likely to push the price upward.
Recognizing a triple bottom pattern helps crypto traders identify key points where the market sentiment is shifting, offering a strategic advantage in anticipating potential bullish momentum. This pattern emphasizes the importance of confirmation through a neckline breakout, which significantly enhances the reliability of potential upward moves.


