
Table of Contents
A triple top is a bearish chart pattern used in technical analysis to indicate a potential reversal of an existing uptrend.
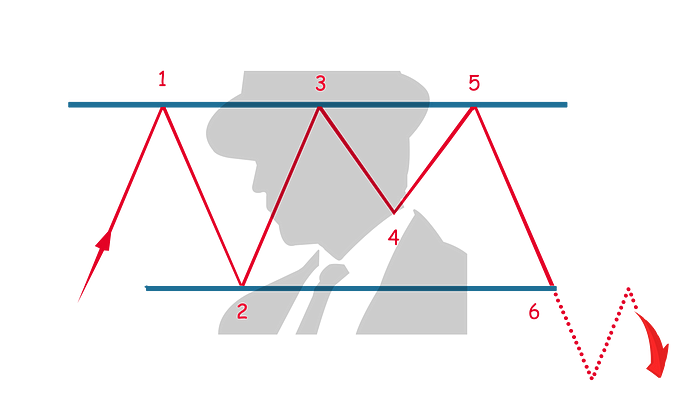
This pattern is characterized by the price reaching and failing to break through a resistance level three consecutive times, forming three distinct peaks at approximately the same level. The triple top is similar to the double top but is considered more bearish due to the repeated failure to break through the resistance.
Here's an in-depth look at the triple-top pattern:
Formation
- Three Peaks: The pattern consists of three peaks, with each peak reaching near the same price point. These peaks are separated by two minor pullbacks.
- Support Level (Neckline): The lows formed by the pullbacks create a support level, known as the neckline. The pattern is confirmed when the price breaks below this neckline after forming the third peak.
Characteristics
- Volume: Volume plays a key role in confirming the triple top pattern. Ideally, the volume should diminish with each successive peak, indicating weakening buying pressure. A strong surge in volume on the price's decline below the neckline helps confirm the pattern's validity and the likelihood of a continued downtrend.
- Time Frame: Triple top patterns can form over various time frames, but they are more reliable when identified on longer-term charts, where the implications for reversal are stronger.
Trading Considerations
- Entry Point: Traders typically consider entering a short position when the price breaks below the neckline. This breakout should be on increased volume to confirm the market's commitment to driving prices lower.
- Stop-Loss: A stop-loss is often placed just above the most recent peak or the neckline, to protect against the price reversing and moving upward.
- Profit Target: The profit target can be estimated by measuring the vertical distance from the neckline to the peaks and extending that distance downward from the neckline where the price breaks down.
Psychological Dynamics
The triple-top pattern reflects a significant level of resistance where buyers repeatedly fail to push the price higher. Each attempt to surpass the resistance diminishes buying momentum, building up sell-side pressure. The eventual breakdown below the neckline indicates that sellers have taken control, and a new downtrend could begin.
Identifying a triple-top pattern provides crypto traders with insights into potential exhaustion in buying pressure, allowing them to position themselves for a reversal. It is crucial for crypto traders to wait for the neckline breakout to confirm the reversal, as premature trading could result in losses if the pattern fails to complete and the price resumes its uptrend.


