
Table of Contents
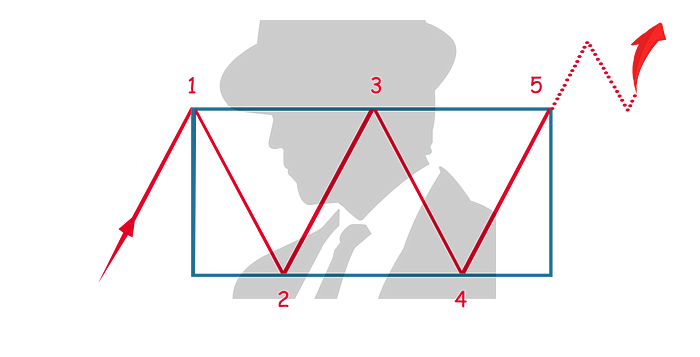
A bullish rectangle is a continuation chart pattern that typically forms during an uptrend in a market. It signals that the price is likely to continue moving upward once the pattern is completed.
Here’s a breakdown of the key characteristics and trading considerations for a bullish rectangle:
Formation
- Consolidation: The pattern forms when prices move sideways between two parallel horizontal lines. This consolidation reflects a balance between buyers and sellers after a significant upward move, indicating that neither side has taken control during this pause.
- Support and Resistance Levels: The bottom line of the rectangle acts as support, where buying interest is strong enough to prevent prices from falling further, while the top line acts as resistance, where selling pressure caps further gains.
Characteristics
- Duration: The pattern can last from a few weeks to several months, depending on the time frame of the chart being analyzed.
- Volume: Typically, volume diminishes as the pattern develops, which reflects the reduction in trading activity during the consolidation phase. A spike in volume is often seen on the breakout, confirming the continuation of the prior trend.
Trading Considerations
- Entry Point: Traders often look to enter a position when the price breaks above the resistance level of the rectangle, as this breakout is considered a confirmation that the previous uptrend is resuming.
- Stop-Loss: To manage risk, a stop-loss can be placed just below the resistance level that has become support after the breakout.
- Profit Target: The expected rise in price after the breakout can be estimated by measuring the height of the rectangle and projecting that distance upwards from the point of breakout.
Psychological Dynamics
The bullish rectangle represents a period where the bulls gather strength and the bears begin to step back, reassessing their positions. Once the price breaks above the top resistance, it indicates that the bulls have taken full control, pushing the market into new highs.
Understanding and recognizing a bullish rectangle can provide crypto traders with strategic insights, helping them to capitalize on the continuation of an existing uptrend.


